At Property Finder, we’re currently going through a process of redesigning elements of our website. This has given us the opportunity to refactor and improve the existing codebase, as well as writing new code from scratch.
You can see our progress so far on the amazing new property detail page on mobile.
What made us invest in web performance?
Since July 2018, Google has modified their ranking algorithm to include website performance, meaning that faster responding websites get better SEO treatment. It therefore made sense for us to invest more in improving and optimizing product performance and monitoring.
Where we are today
In order to make improvements, we first needed to understand what our current situation was.
To get these insights, we used different Real User Monitoring (RUM) tools, such as Akamai mPulse and NewRelic for browsers. These gave us the ability to gather different metrics from the devices of a real user on our platform.
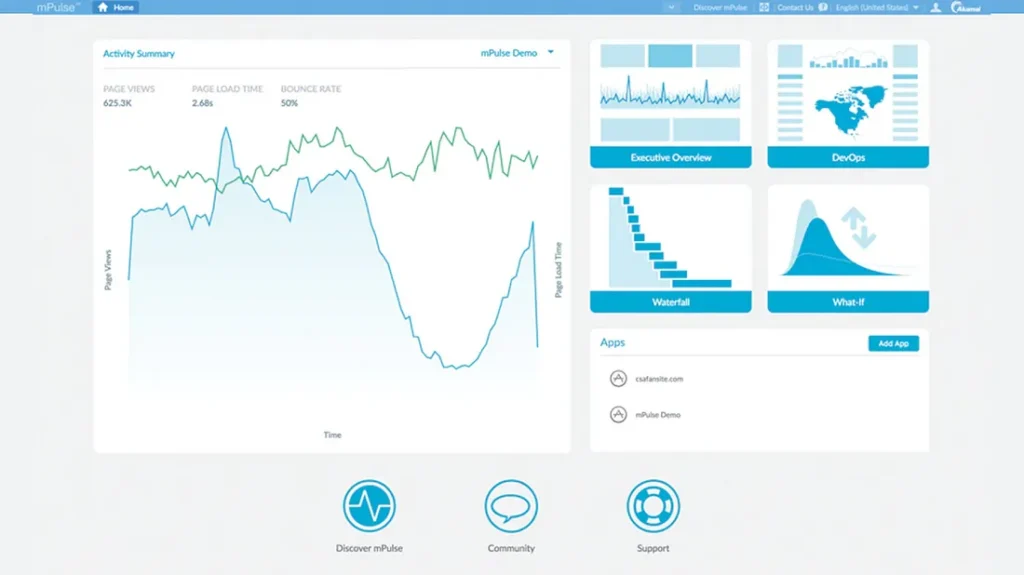
The reason we used RUM tools is because, starting from July 2019, Google introduced mobile-first indexing, which means that for indexing and ranking, your page will be treated as if it was opened in mobile browser of a real mobile phone. That is why we’re paying more attention to how our application performs on mobile with different CPUs and network conditions.
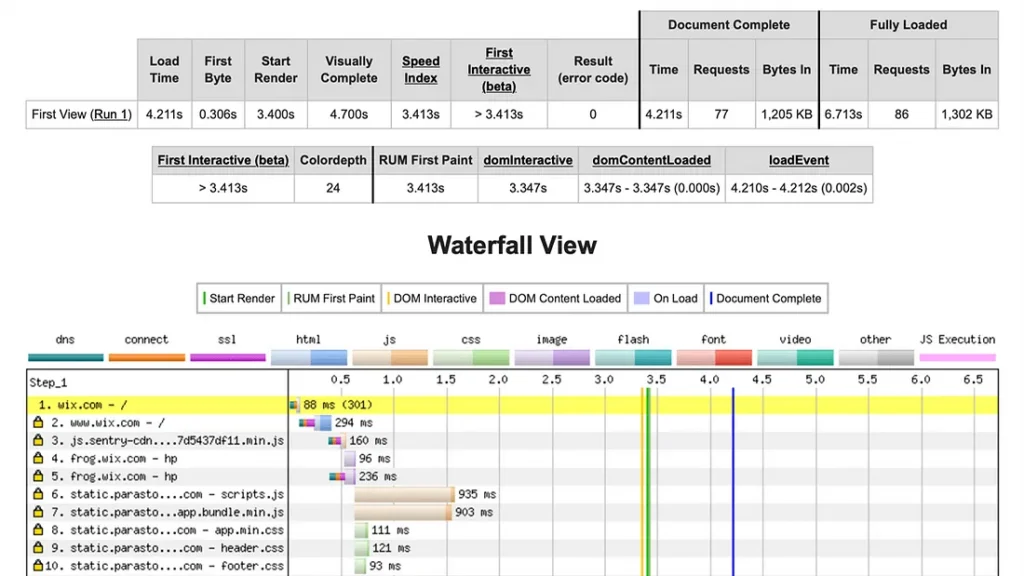
There are lots of tools for gathering information about performance; my favourites are WebPageTest.org, GTmetrix, Google PageSpeed Insights (GPI) and browsertime. All of them are amazing tools, and provide a lot of data about your application. However, they are quite different in terms of use and reporting.
WebPageTest and browsertime
WebPageTest and browsertime both have the following advantages:
- Very rich in terms of data
- Provide filmstrip and timeline videos to get a visual feel of website performance
- Tests can be executed in different regions on different machines to get the most accurate insights
On the other hand, it’s very hard to extract specific insights out of the information WebPageTest and browsertime provide.
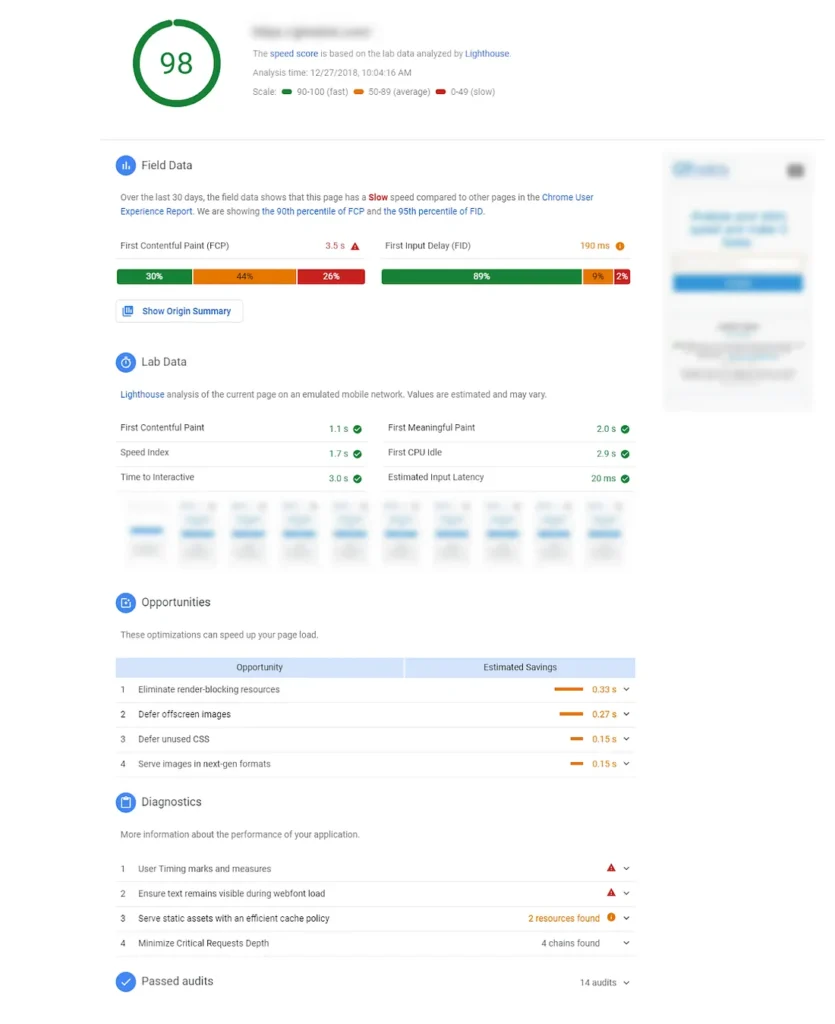
Google PageSpeed Insights
Google PageSpeed Insights (GPI) has a better way of representing results, but it lacks detail. Some of the key advantages of GPI are:
- Easy to use
- Provides nice UI and UX (is responsive and you can view reports on mobile)
- Is easy to integrate into CI/CD
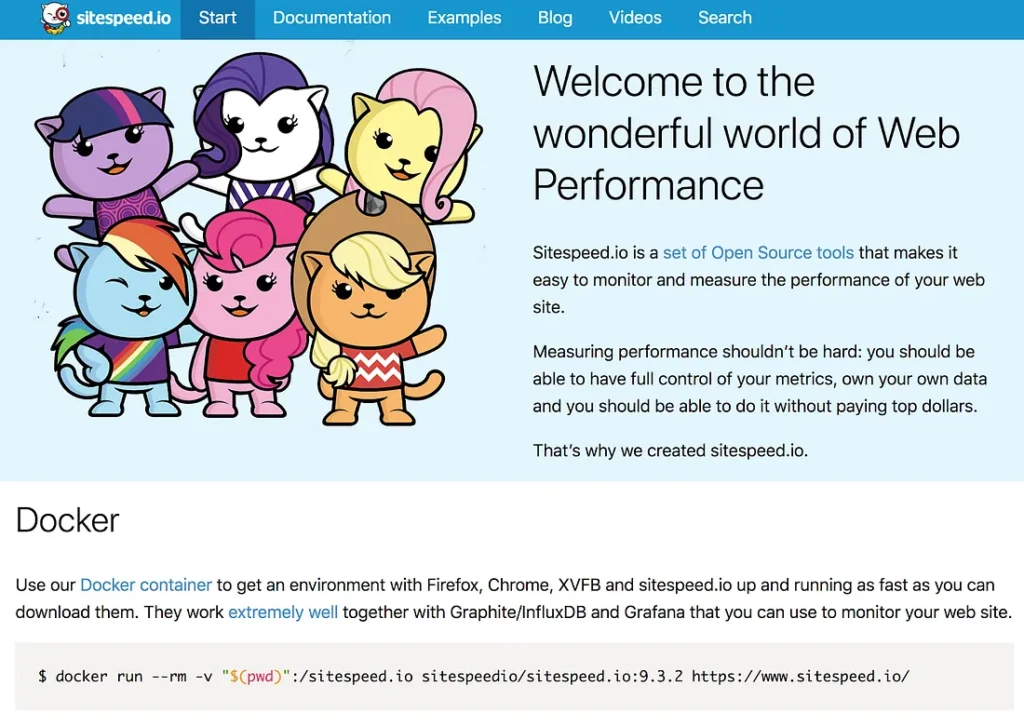
The tool for us: sitespeed.io
While all of the above tools have been useful for us, we needed something that combines the data-richness of webpagetest and also gives a way to get the most value out of this data. The tool which suited all of our needs is called sitespeed.io. This is a set of Open Source tools that makes it easy to monitor and measure the performance of web site.
Some of the advantages of sitespeed.io are:
- It is open source
- It is easy to install and configure
- It has lots of integrations and plugins
- It is highly customizable
- It combines multiple tools in one solution
Additionally, you can use it as a separate npm package or as docker container with all the dependencies installed. Sitespeed.io can also report to Graphite or InfluxDB time series databases which work very well with Grafana and gives us the ability to generate custom reports and create complex visualizations.
Grafana
With Grafana, we are also able to define performance budgets and alerts and track the health of our multiple products in one place. Having Grafana as the default tool for analytics and monitoring means that we can share the knowledge of application performance across backend, front end and devops teams and be able to see trends and relations between changes in metrics not only from the frontend part of application, but also from the backend as well as the database.
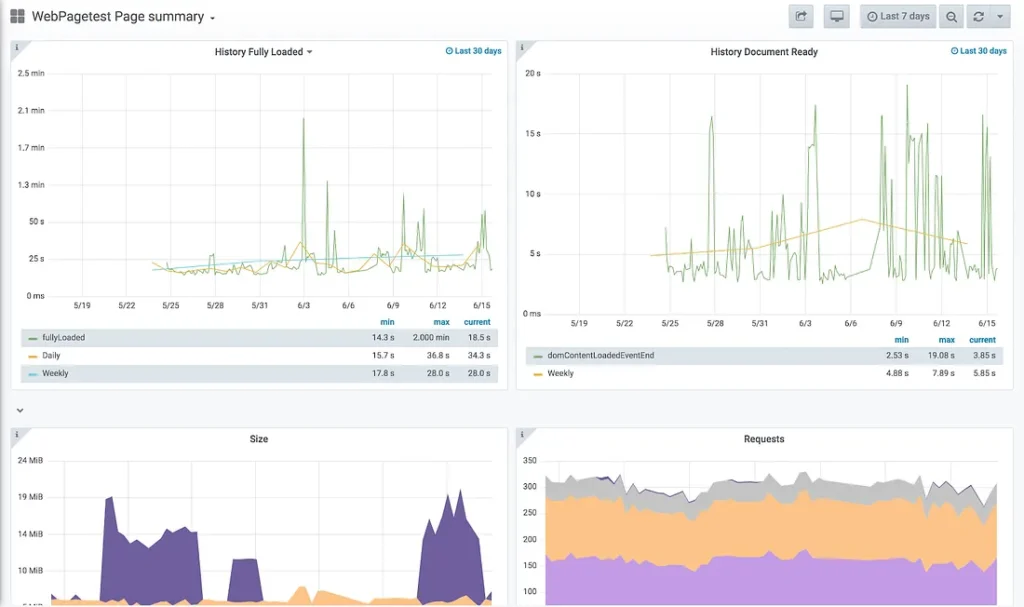
What we measure
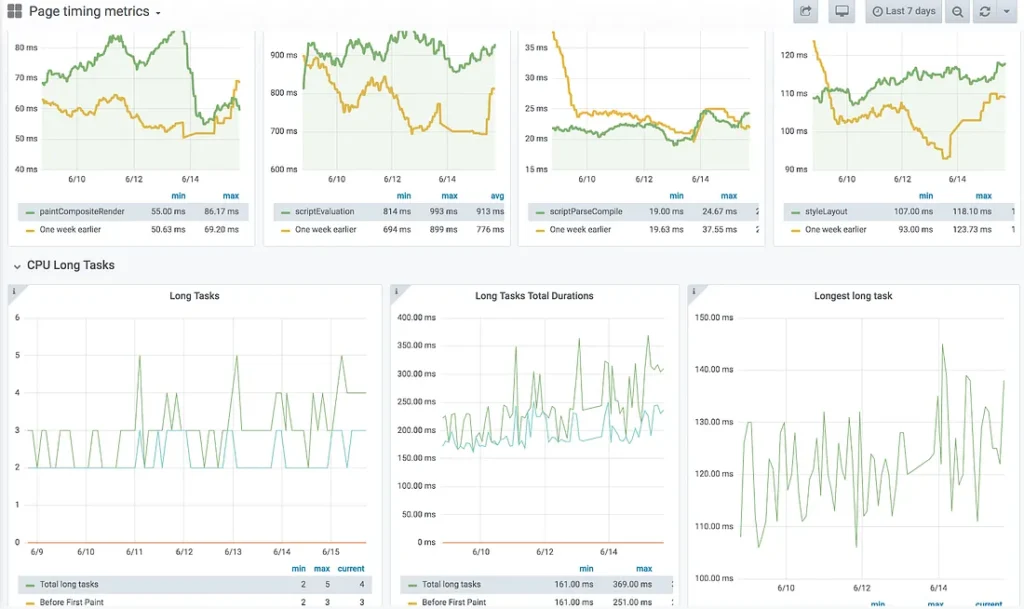
At Property Finder, we focus on metrics that capture the user experience and have an impact on SEO ranking. A big part of the user experience is when content actually appears in front of the user. At this step, we’re tracking the amount of critical blocking resources, their size and impact on page load. Other important metrics at this stage are start render, speed index and time to first byte. The overall size of website also matters and we keep track of performance and size of every type of our assets (be it internal JavaScript, third party libraries, images, fonts, css, xhr requests and so on). Apart from that, we also care about other metrics that are not network related. This is because network speed is not currently the biggest problem when it comes to making websites fast. Today, CPU is the main concern. Therefore, we track and optimize first CPU idle time, first input delay time, first interaction time and total long task CPU time. We’re also get generic insights and set budgets from GPI, this allows us to have generic picture on SEO score for Google’s search engine.
How we measure
In order to keep website healthy and performant, tracking is not enough. We care about the impact on performance of every feature or change we make on the website. To make sure we ship only the most optimized code, we have performance measurement integrated into our CI/CD processes and we measure the performance of certain changes as well as the impact on overall performance when we introduce a change.
Measurements are also done in different environments so we can be confident that things that are going live are properly tested and do not degrade but only improve user experience and website performance.
Since Property Finder operates in multiple countries with different network conditions and device trends, it’s crucial for us to be as close as possible to the user in every region. There are multiple ways to real world performance stats. Some of them are triggering synthetic performance checks using most popular devices in specific region or using real user monitoring (RUM) data. The idea behind RUM is that you’re getting insight from users of your application. In theory such monitoring will produce more accurate, real world data. In practice it’s not always the case. Specially when it comes to monitoring of web performance. Why? Well… because of JavaScript. You would have to inject an additional piece of JavaScript code, which consists of calling different browser APIs and which usually would have to be executed many times throughout the application lifetime and most of the time consists of blocking JavaScript code. Therefore we’re trying to limit ourselves from using RUM tools and only use RUM data when we really need to investigate and get deeper insights on certain real-world metrics.
Acting to improve: democratising the process
While it’s all well and good to collect this huge amount of data on our product’s performance, we’d be fools not to use it. As Einstein said:
Information is not knowledge.
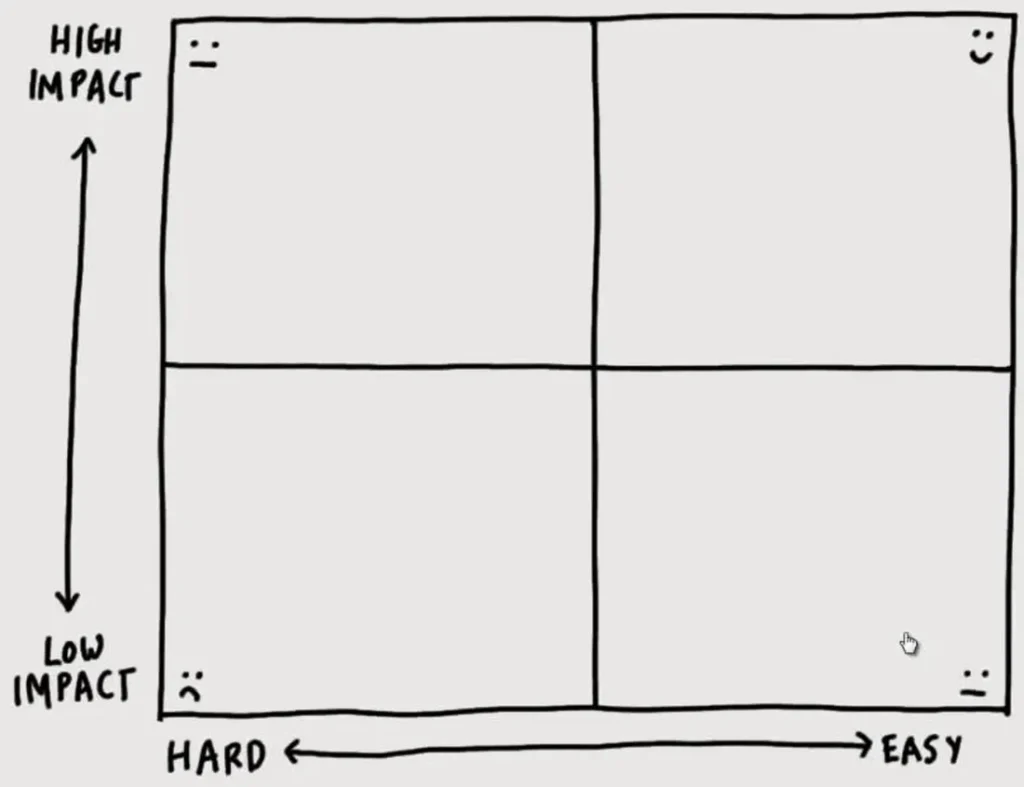
By analyzing performance reports, we can plan our optimization strategy. In some cases the path to improvement is very simple and only a few small changes need to be done in order to get significant gains (these are our favorite cases!). In other cases, optimizations are too complex and have a small impact on performance. Therefore, we prioritize based on effort and impact.
To move fast and work smart, proper planning is needed and usually the whole team gets involved in the conversation to make a decision on whether we should we schedule time and resources for improvement, or should postpone it and focus on other business needs.
We also set up web performance meetups to which people from across the company are invited. There we discuss cross-organizational aspects of the website which have a direct or indirect influence on website performance. It’s very important to get non-technical teams involved in this conversation, so that every member of the company will know his or her impact on performance and the speed of the website.
In conclusion
In order to be the most performant on the web, we:
- Keep track of our performance using data from multiple sources
- Measure and study key metrics which are important for business
- Make decisions based on learnings from performance data
- Inform and educate company members about web performance and how to maintain and improve our speed
If you liked this article and want to be part of our brilliant team of engineers who produced it, then have a look at our latest vacancies here.